The Core Sample and the Claim: Reading Soil Carbon Beneath Bubney's Rows
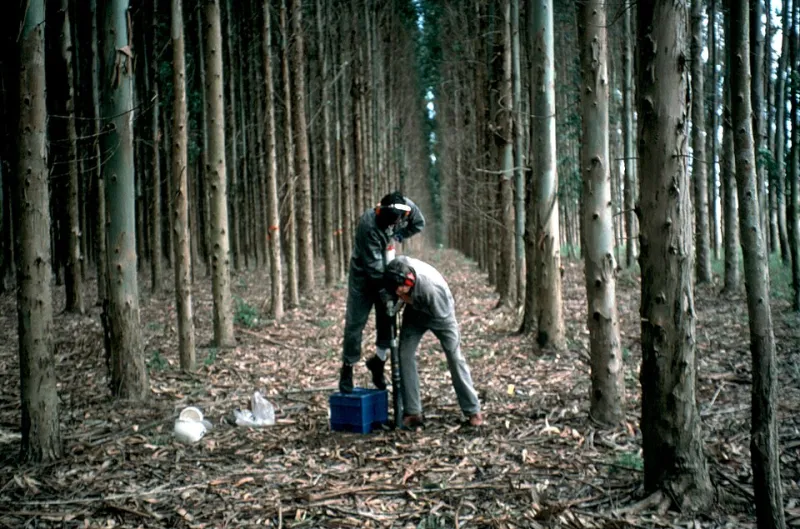
Photo: T.Grove, CSIRO, CC BY 3.0, via Wikimedia Commons
A solar farm is judged largely by what can be seen: rows of modules, a substation, a hedge-line left intact. The soil beneath the array attracts far less attention, even though it is the part of the site that will outlast the panels. Soil carbon, in particular, has become a familiar phrase in planning documents and sustainability summaries. It is also one of the easier claims to make and one of the harder claims to substantiate.
At Bubney, soil sampling is treated as an operational task rather than a public-relations exercise. The purpose is not to produce a headline figure but to understand whether the ground is being protected, compacted, enriched or simply left alone. That distinction matters in a sector where vague promises about “improving soil health” can travel further than the evidence behind them.
Why soil carbon resists a simple number
Soil organic carbon is the carbon held in decaying plant material, roots, microbes and the broader soil matrix. It is usually reported as a concentration, a percentage or a stock in tonnes per hectare. Each of those figures depends on depth, bulk density, stone content and the laboratory method used. A change in any one of them can make a result look better or worse without any real change in the field.
British soils add their own complications. Clay-rich soils can hold substantial carbon but vary sharply over short distances. Sandy soils drain quickly and may lose organic matter under cultivation. Permanent pasture, which often preceded a solar development, may already carry relatively high carbon stocks. Comparing an array with an unimproved field next door is not necessarily comparing like with like.
There is also the question of time. Soil carbon changes slowly. A single season of grass growth beneath panels will not transform a field’s carbon stock, and a single sampling round cannot prove that a solar farm has caused a gain or a loss. The honest unit of analysis is not one sample but a sequence of samples, taken consistently, alongside a clear baseline.
From field to laboratory
A soil carbon result begins with a core. At Bubney, sampling is organised on a grid that includes points beneath the panels, between rows and in reference areas outside the array. The reference areas are not a perfect control, but they help distinguish site-wide trends from changes specific to the array.
Samples are usually taken in depth increments, commonly 0–10 centimetres and 10–30 centimetres. Deeper sampling is possible but more expensive and less frequently repeated. Each core is logged, bagged and sent to an accredited laboratory. The two main analytical routes are loss on ignition, which estimates organic matter by burning off the organic fraction, and dry combustion, which measures carbon directly. Loss on ignition is widely used and relatively cheap, but it can overestimate organic carbon in some soils, particularly those containing carbonates or certain clays. Dry combustion is generally regarded as more precise, though it costs more.
Bulk density is the unglamorous companion measurement. Without it, a carbon concentration cannot be converted into a stock. A field can show a higher percentage of carbon simply because the soil has become more compacted and a given volume weighs more. That is one reason reputable monitoring uses equivalent soil mass or reports bulk density alongside carbon concentration.
What Bubney is actually measuring
The site’s monitoring programme combines routine chemical analysis with simple physical observations. Alongside soil organic carbon, samples are tested for pH, texture and nutrient status. Field staff record penetration resistance, which gives an indication of compaction, and note earthworm activity and root presence where swards are inspected. Sheep grazing between the rows is managed to avoid poaching in wet conditions.
The array itself changes the microclimate. Panels cast shade, reduce wind speed and alter rainfall interception. In some conditions, that can reduce grass growth beneath the modules; in others, shelter may help. The net effect on root litter and organic matter inputs is not obvious in advance. It has to be measured.
Construction is the other major influence. Heavy vehicles, cable trenching and temporary haul routes can compact soil and disturb the sward. Good practice involves low-ground-pressure machinery, timing works to avoid wet soils and keeping trafficking to defined routes. Where compaction is detected, aeration or subsoiling may be considered, but only after diagnosis. Cultivating a field to solve a problem that has not been confirmed is rarely wise.
What the results can and cannot prove
Soil carbon data can show whether stocks are stable, rising or falling within the limits of sampling and analytical uncertainty. It can identify localised compaction or poor establishment. It can inform grazing management and maintenance schedules. It cannot, on its own, prove that a solar farm is responsible for a regional climate benefit, nor can it guarantee that a field will remain a carbon sink for the life of the array.
Claims of “carbon-neutral construction” or “soil carbon gains” should therefore be read carefully. A developer may have commissioned a baseline survey, but the relevant questions are whether the same points were resampled, whether bulk density was measured, whether reference areas were used and whether the laboratory methods are stated. Without those details, a number is an assertion rather than a finding.
At Bubney, the aim is to publish method and uncertainty alongside any headline result. That is less satisfying than a bold claim, but it is more useful. A solar farm occupies land for decades. The soil beneath it should leave the site in no worse condition than it arrived, and ideally in better. Proving that requires patience, cores, laboratories and a willingness to report what the ground actually says, even when it is less tidy than the brochure.