Instruments in the Grass: How a Solar Farm Reads the Weather It Works Within

Photo by Photo by Nik on Unsplash on Unsplash
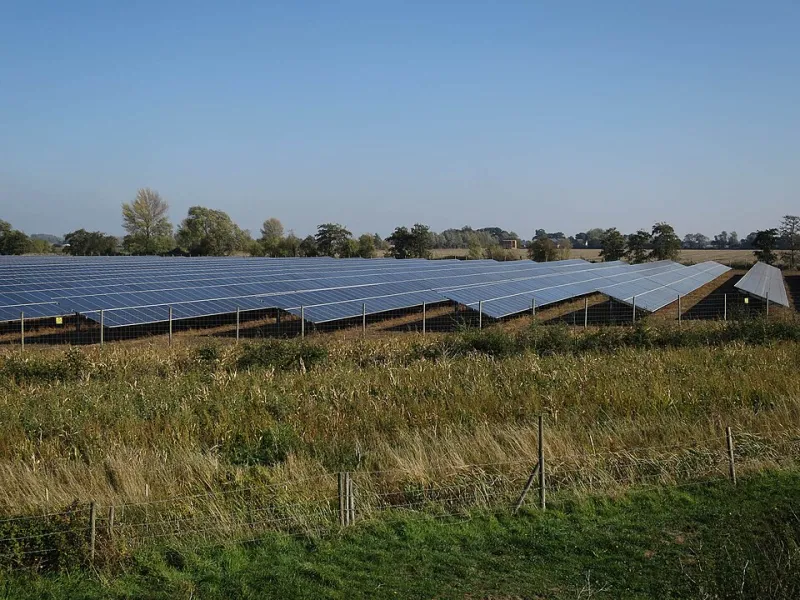
As November 2026 brings shorter days and softer light to the Bubney site, the most closely watched equipment is not always the array itself. A small cluster of instruments stands beside the access track: a pyranometer, a reference cell, temperature probes, a rain gauge, an anemometer and soil-moisture sensors. They are modest in appearance and easy to overlook. Yet they give the solar farm a working picture of the weather it operates within, hour by hour and season by season.
A small network with a large brief
The monitoring at Bubney is not designed to rival a formal meteorological station. Its first purpose is operational. Irradiance sensors record how much solar energy reaches the plane of the modules. A reference cell offers a practical cross-check against the output of the array. Thermistors attached to the back of selected modules show how panel temperature rises and falls. Air temperature, humidity, rainfall, wind speed and soil moisture complete the set.
Each measurement answers a question the site staff would otherwise have to guess. How bright is it, really, compared with the forecast? Has a gust exceeded the threshold for a precautionary inspection? Is the ground firm enough for a service vehicle? Has rainfall been heavy enough to warrant a check on drainage and track edges? The instruments do not make decisions, but they inform them.
From millivolts to megawatt-hours
The UK’s weather is rarely tidy. A bright morning can give way to stratocumulus by lunchtime; a clear winter afternoon can produce sharp shadows and low temperatures at the same time. For a solar farm, the useful question is not simply whether the day is sunny. It is how much irradiance arrives, at what angle, and how the modules respond.
Bubney’s records allow the operations team to compare forecast generation with actual output. On days when the sky is broken, the gap between the two can be instructive. If output is lower than expected while irradiance is close to forecast, the cause may lie elsewhere: temperature effects, soiling, inverter behaviour or a fault. If irradiance itself is lower than expected, the forecast model may need a local correction. Over time, these comparisons build a more realistic picture of how this particular site behaves in British conditions.
Module temperature matters as well. Photovoltaic panels lose a little efficiency as they warm, so a bright but cool spring day can produce a stronger response than a hot, hazy afternoon in July. The temperature probes help explain those differences and provide context for maintenance staff reviewing performance.
The maintenance decisions hidden in the numbers
Weather data is often associated with forecasting, but at a working solar farm it is just as useful for maintenance. Wind speed records help determine when an inspection is prudent after a gusty spell. Rainfall data shows when access tracks may need checking for erosion or standing water. Soil-moisture readings can guide whether heavy machinery should be kept off soft ground, protecting both the land and the grass cover between rows.
Temperature and humidity also provide background for condition monitoring. They cannot replace a thermal imaging survey or a visual inspection, but they help staff interpret what those checks find. A warm module on a cool day may deserve attention; a warm module on a hot afternoon may simply be doing what modules do.
The records are most valuable when they are consistent. A sensor that is moved, shaded or allowed to drift out of calibration tells a less trustworthy story. Bubney’s monitoring therefore includes routine checks: cleaning the pyranometer dome, confirming the rain gauge is clear, inspecting cable runs and noting any change in the immediate surroundings. The metadata, the plain record of what was measured and where, is as important as the numbers themselves.
Habitat management by measurement
The weather record also supports the land around the array. Soil moisture and rainfall influence when grassland management or grazing rotations should be adjusted. Temperature records help explain the timing of growth in spring and the slow-down in autumn. On a dual-use site, where sheep may graze between the rows, ground conditions are a practical concern as well as an ecological one.
This is not climate science in miniature. It is farm-scale observation. Yet it encourages a more patient view of the site: the solar farm is not only producing electricity; it is also a piece of managed land responding to the same weather as the surrounding fields.
A quiet contribution to the climate record?
The wider question is whether solar farms could become a useful part of the UK’s long-term climate record. The answer requires care. Most site instruments are selected for operations rather than research. They may be replaced, relocated or affected by vegetation and panels. Their records are local, and local records are not the same as a national network.
Even so, a well-documented solar farm can add context. Hundreds of sites recording irradiance, rainfall, wind and temperature over many years could reveal patterns in local weather and ground conditions. If the records are kept with clear metadata and consistent methods, they may complement official observations rather than compete with them. The value would lie in coverage and continuity, not in claiming precision beyond what the equipment can deliver.
As November 2026 draws the site into winter, the instruments continue their quiet work. The harvest they represent is invisible: not electricity, but evidence. At Bubney, that evidence helps the array run safely, the land be managed sensibly and the forecasts grow more honest. Over time, it may also become a modest part of how the local climate is remembered.